31

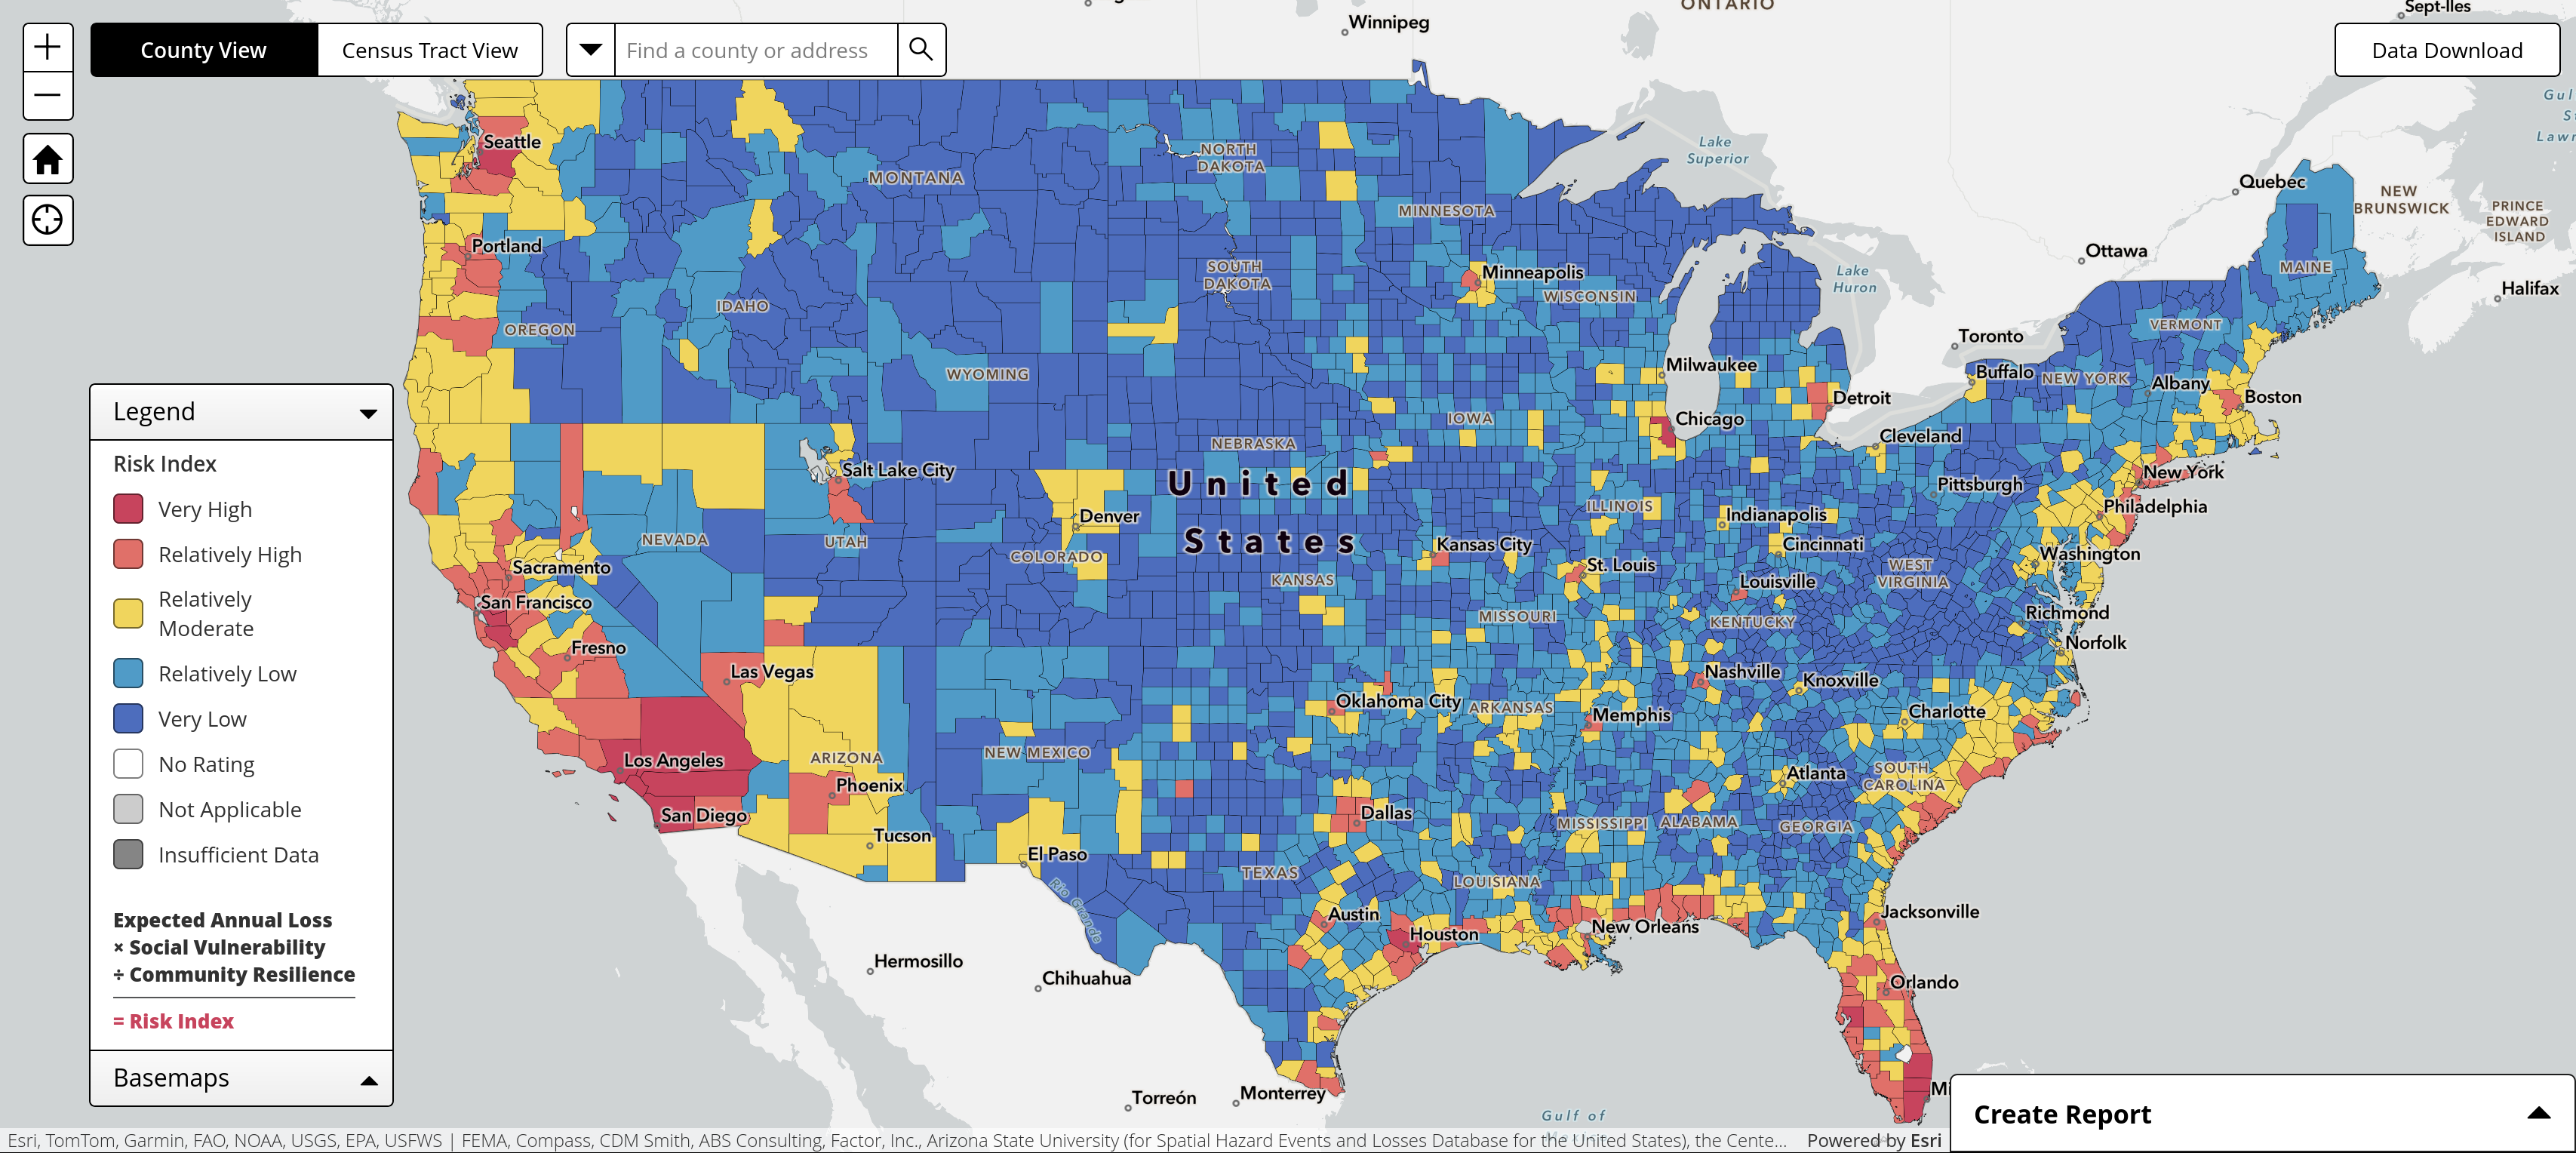
FEMA Natural Hazards Risk Index
@map_enthusiasts
Source: https://hazards.fema.gov/nri/map
#maps

top 7 comments
sorted by: hot top controversial new old
[-] ElderWendigo@sh.itjust.works 16 points 8 months ago

This looks suspiciously like a population density map.

[-] adhocfungus@midwest.social 9 points 8 months ago

Apparently the calculation includes "Social Vulnerability", which looks very much like a population map. Which is probably why my city is yellow due to winter weather even though the surrounding counties are blue.

[-] awwwyissss@lemm.ee 4 points 8 months ago

Yeah they should really call it the Disaster Risk Index because hazards are only part of the disaster equation, the other part is vulnerability.

A tornado in the ocean isn't a disaster.

[-] ECB@feddit.de 2 points 8 months ago

Buffalo, eh?

[-] neptune@dmv.social 5 points 8 months ago

If you select a county you can see what type of hazards the consider. I wondered especially about the county in NW TX (Lubbock) and saw that FEMA rates it high for things like wind, riverine flooding, winter weather, etc.

[-] Blaze@discuss.tchncs.de 4 points 8 months ago

Thanks for sharing!

[-] GIS_Bandit@mastodon.world 2 points 8 months ago
this post was submitted on 17 Jan 2024
31 points (100.0% liked)

Map Enthusiasts

3397 readers
67 users here now

For the map enthused!

Rules:

founded 1 year ago
MODERATORS