407
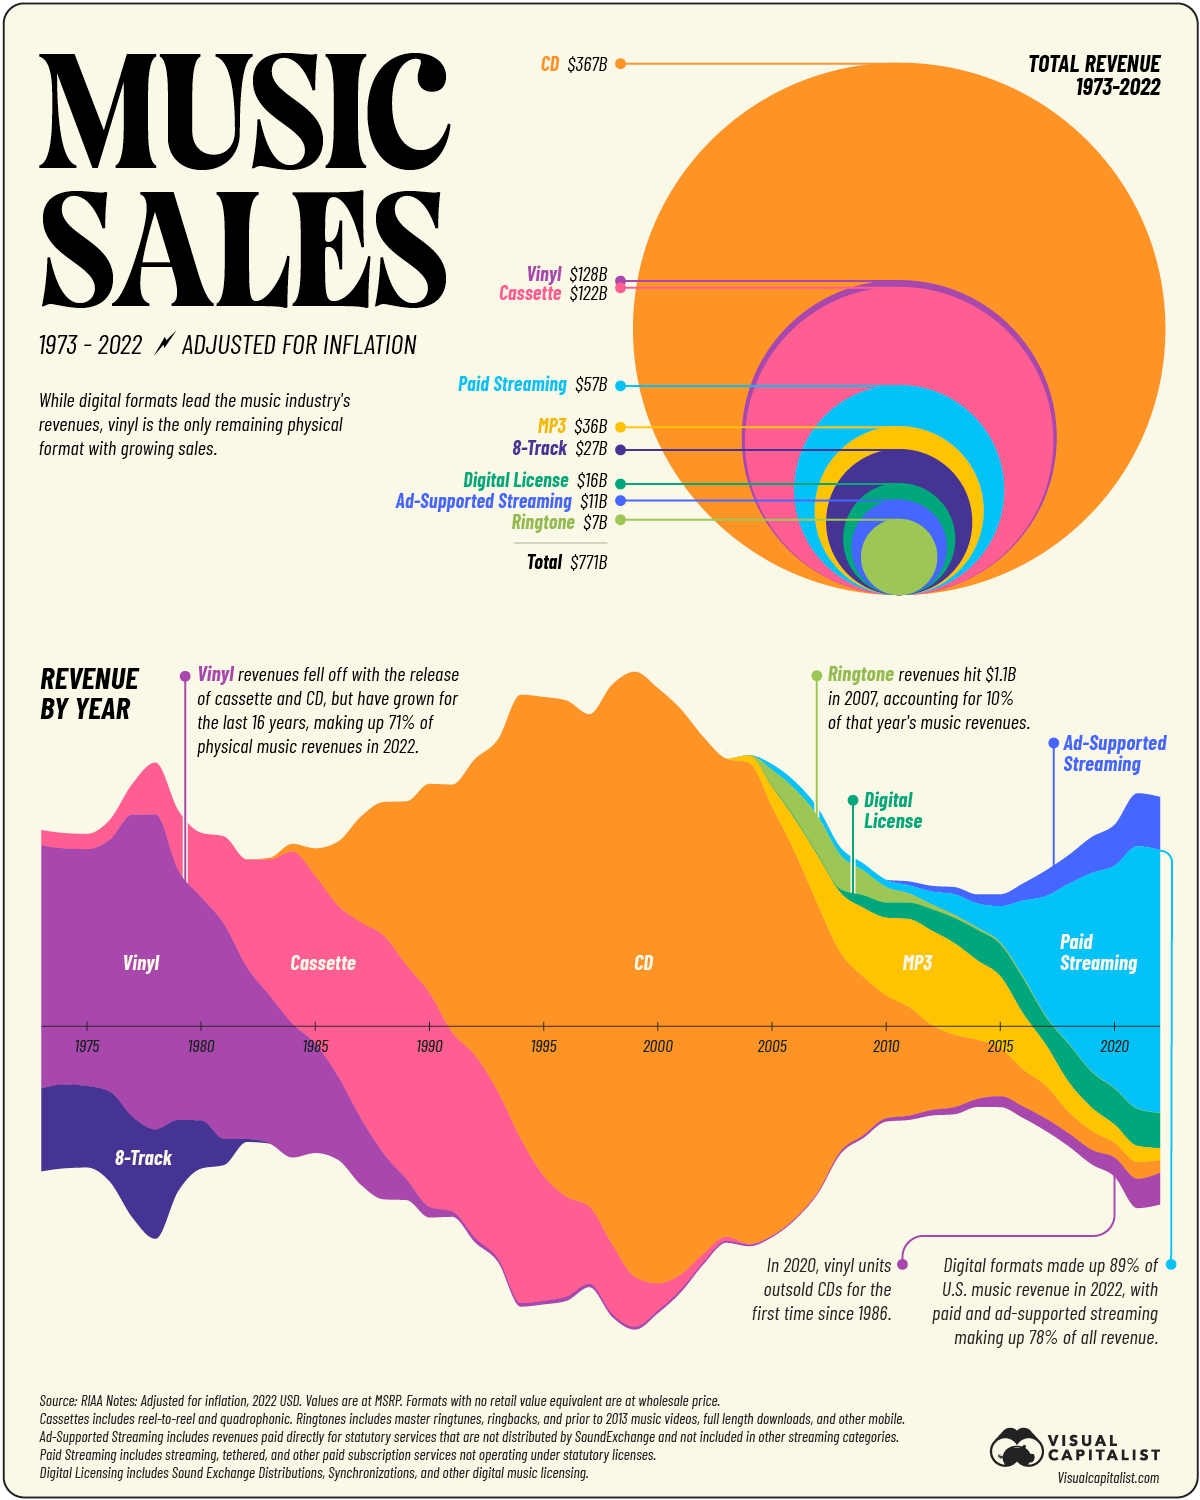
Evolution of recorded-music revenue over the last 50 years
(files.mastodon.social)
ht to @hilljam@mastodon.social
ht to @hilljam@mastodon.social
A place to share and discuss data visualizations. #dataviz
(under new moderation as of 2024-01, please let me know if there are any changes you want to see!)
surface of the circle is directly proportional to the revenue, this presentation is much better to compare two values to each other (if you have problem comparing how much 367 is compared to 128 and need an image for that, that is). it would be harder in the pie chart.
if you want share of the total, the bottom graph is much better for that (and it adds layer of information that pie graph wouldn't have).
i assume that is why.
Circle area's are really hard to compare. A circle with double the area of another barely looks bigger.
But circles are hard to compare directly. A square would be much better or even a bar chart.
This is trying to be flashy and it gets in the way of the information.