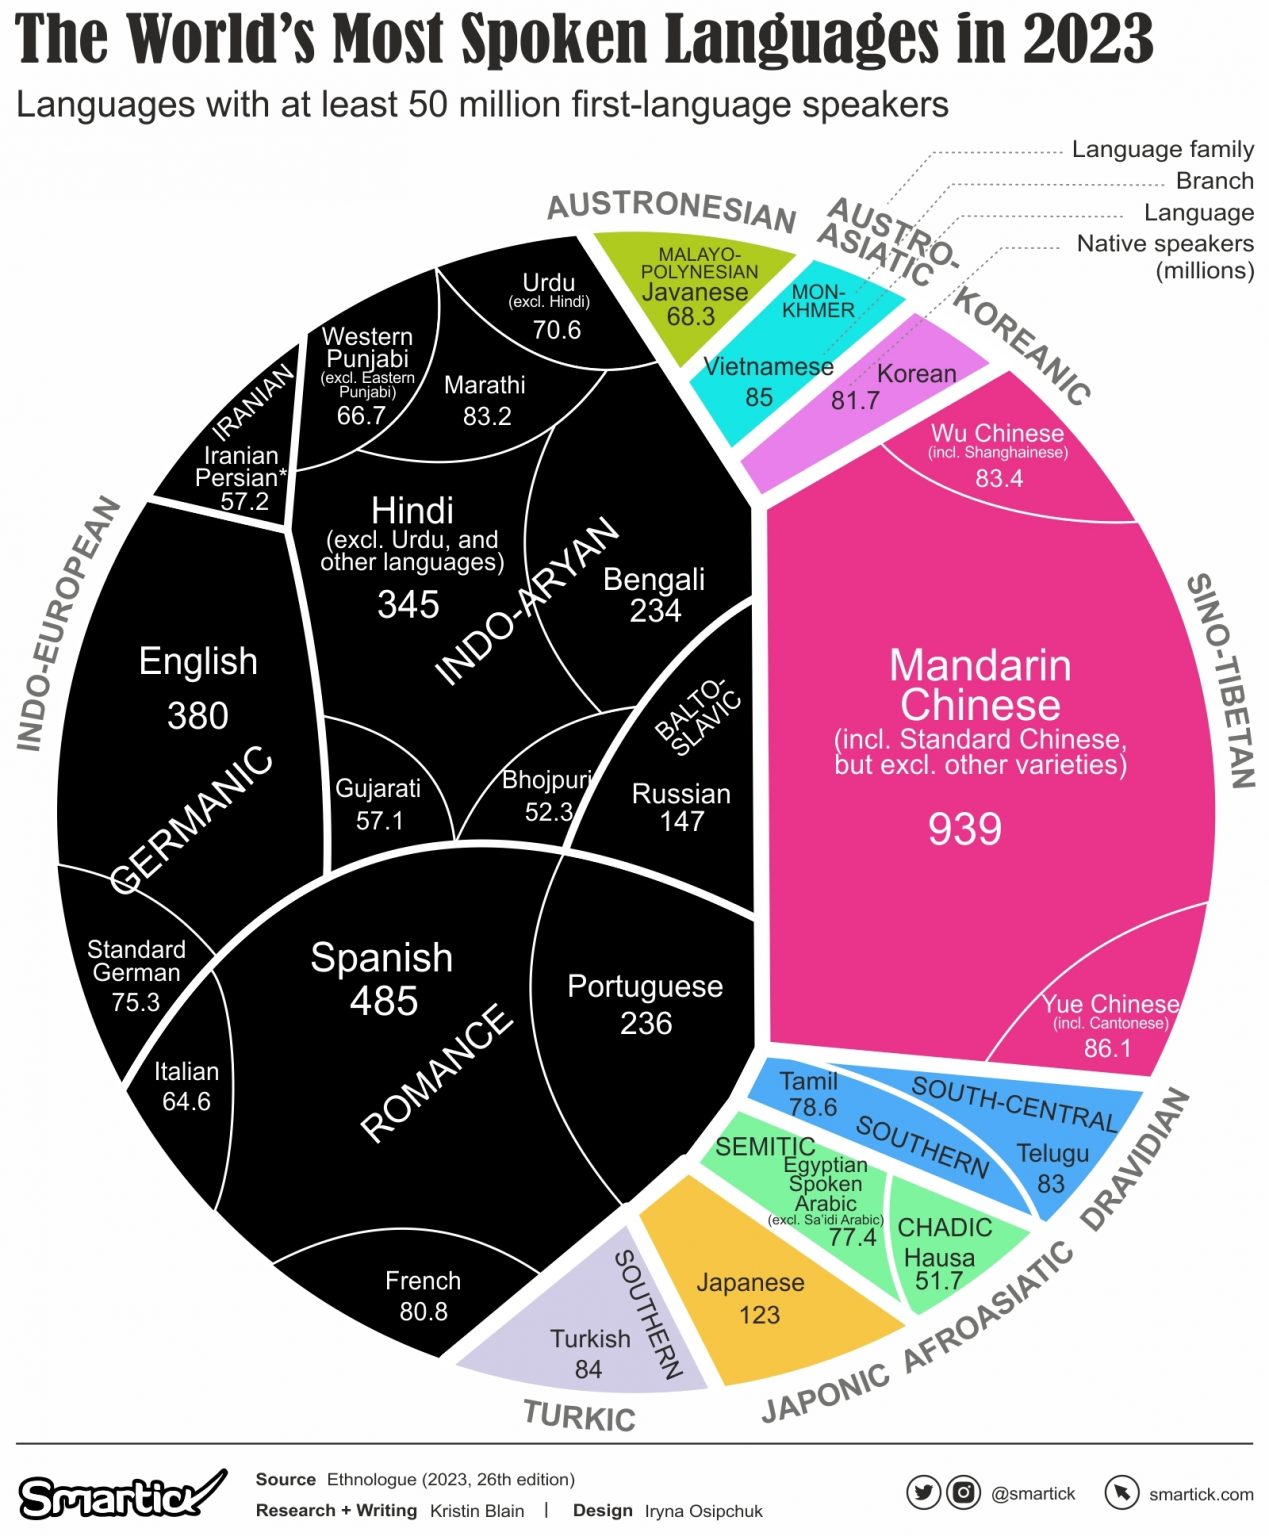
129
submitted 1 year ago* (last edited 1 year ago) by zoe@infosec.pub to c/dataisbeautiful@lemmy.ml
you are viewing a single comment's thread
view the rest of the comments
[-] Jaydeep@lemmy.world 2 points 1 year ago* (last edited 1 year ago)

What kind of graph is this? Can I make it with matplotlib?

[-] jana@leminal.space 5 points 1 year ago

Looks like a voronoi treemap

this post was submitted on 07 Oct 2023
129 points (92.7% liked)

Data Is Beautiful

5773 readers
1277 users here now

A place to share and discuss data visualizations. #dataviz


(under new moderation as of 2024-01, please let me know if there are any changes you want to see!)

founded 3 years ago
MODERATORS