this post was submitted on 21 Nov 2024
189 points (97.5% liked)

Map Enthusiasts

3607 readers
6 users here now

For the map enthused!

Rules:

founded 2 years ago
MODERATORS
 
you are viewing a single comment's thread
view the rest of the comments
[–] merde@sh.itjust.works 3 points 1 month ago* (last edited 1 month ago) (1 children)

New Mexico's history has contributed to its unique demographic and cultural character. It is one of only seven majority-minority states, with the nation's highest percentage of Hispanic and Latino Americans and the second-highest percentage of Native Americans, after Alaska. The state is home to one–third of the Navajo Nation, 19 federally recognized Pueblo communities, and three federally recognized Apache tribes. Its large Hispanic population includes Hispanos descended from settlers during the Spanish era, and later groups of Mexican Americans since the 19th century.

In the United States of America, majority-minority area or minority-majority area is a term describing a U.S. state or jurisdiction whose population is composed of less than 50% non-Hispanic whites. It is defined as a population with a collective majority of nationwide minorities, meaning a grouping of racial and ethnic groups (other than the national majority) that composes over 50% of the territorial population, regardless if one of those minority groups already attains a majority on its own. No single minority is yet the majority in any state, with the closest to that end being Hispanics in New Mexico (49% of the total population as of the 2020 census).

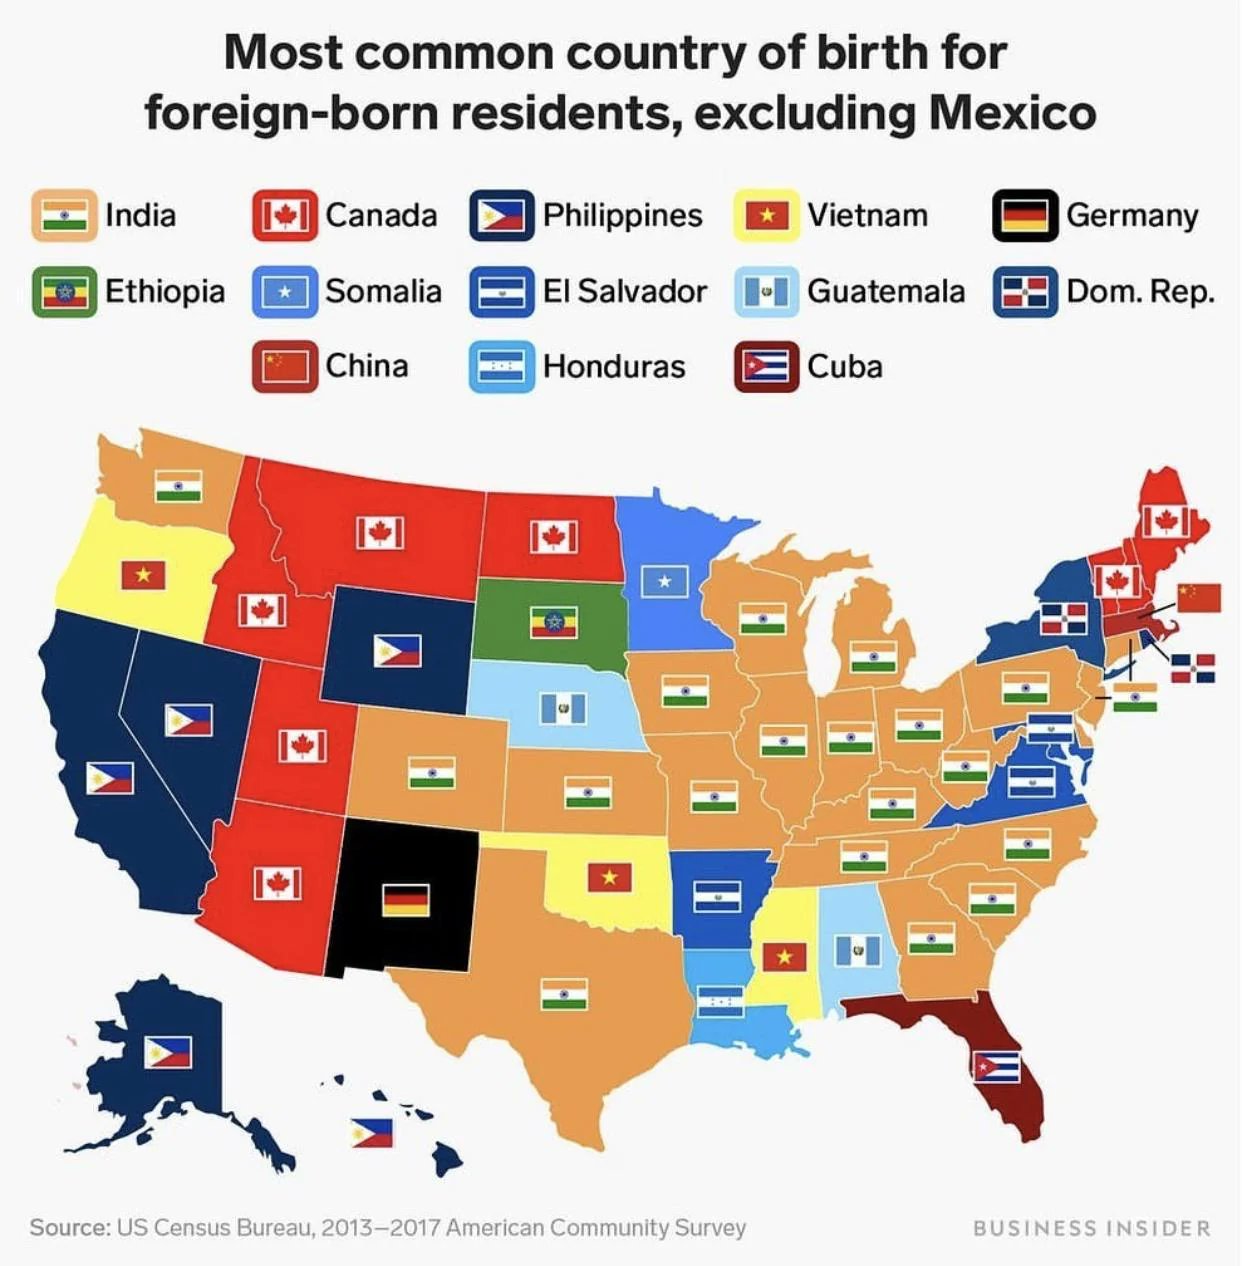
A little over 9% of New Mexican residents are foreign-born, and an additional 6.0% of U.S.-born residents live with at least one immigrant parent. The proportion of foreign-born residents is below the national average of 13.7%, and New Mexico was the only state to see a decline in its immigrant population between 2012 and 2022.

In 2018, the top countries of origin for New Mexico's immigrants were Mexico, the Philippines, India, Germany and Cuba. As of 2021, the vast majority of immigrants in the state came from Mexico (67.6%), followed by the Philippines (3.1%) and Germany (2.4%).

shouldn't it rather be the Philippines flag there?

[–] cypherpunks@lemmy.ml 4 points 1 month ago* (last edited 1 month ago)

You're quoting something that says its from 2021, but OP's image cites the 2013-2017 American Community Survey as its source.

Meanwhile, this interactive map (maybe from 2022?) indicates that only 0.29% (6,181 people) of New Mexico's population were born in the Philippines, and 0.18% (3,753 people) were born in Germany.