I love Zabbix and I worked with it for the past seven(ish) years. There are better solutions though, and all of your points are absolutely valid.
About which sensor to monitor, just disable those you don't want in the host.
A community dedicated to the profession of IT Systems Administration
No generic Lemmy issue posts please! Posts about Lemmy belong in one of these communities:
!lemmy@lemmy.ml
!lemmyworld@lemmy.world
!lemmy_support@lemmy.ml
!support@lemmy.world
I love Zabbix and I worked with it for the past seven(ish) years. There are better solutions though, and all of your points are absolutely valid.
About which sensor to monitor, just disable those you don't want in the host.
What are the better solutions that you're referring to? I'm setting up monitoring at work now and want to make sure I hit the target with whatever I put in place. Right now I'm dabbling with Prometheus and grafana and it's been decent so far.


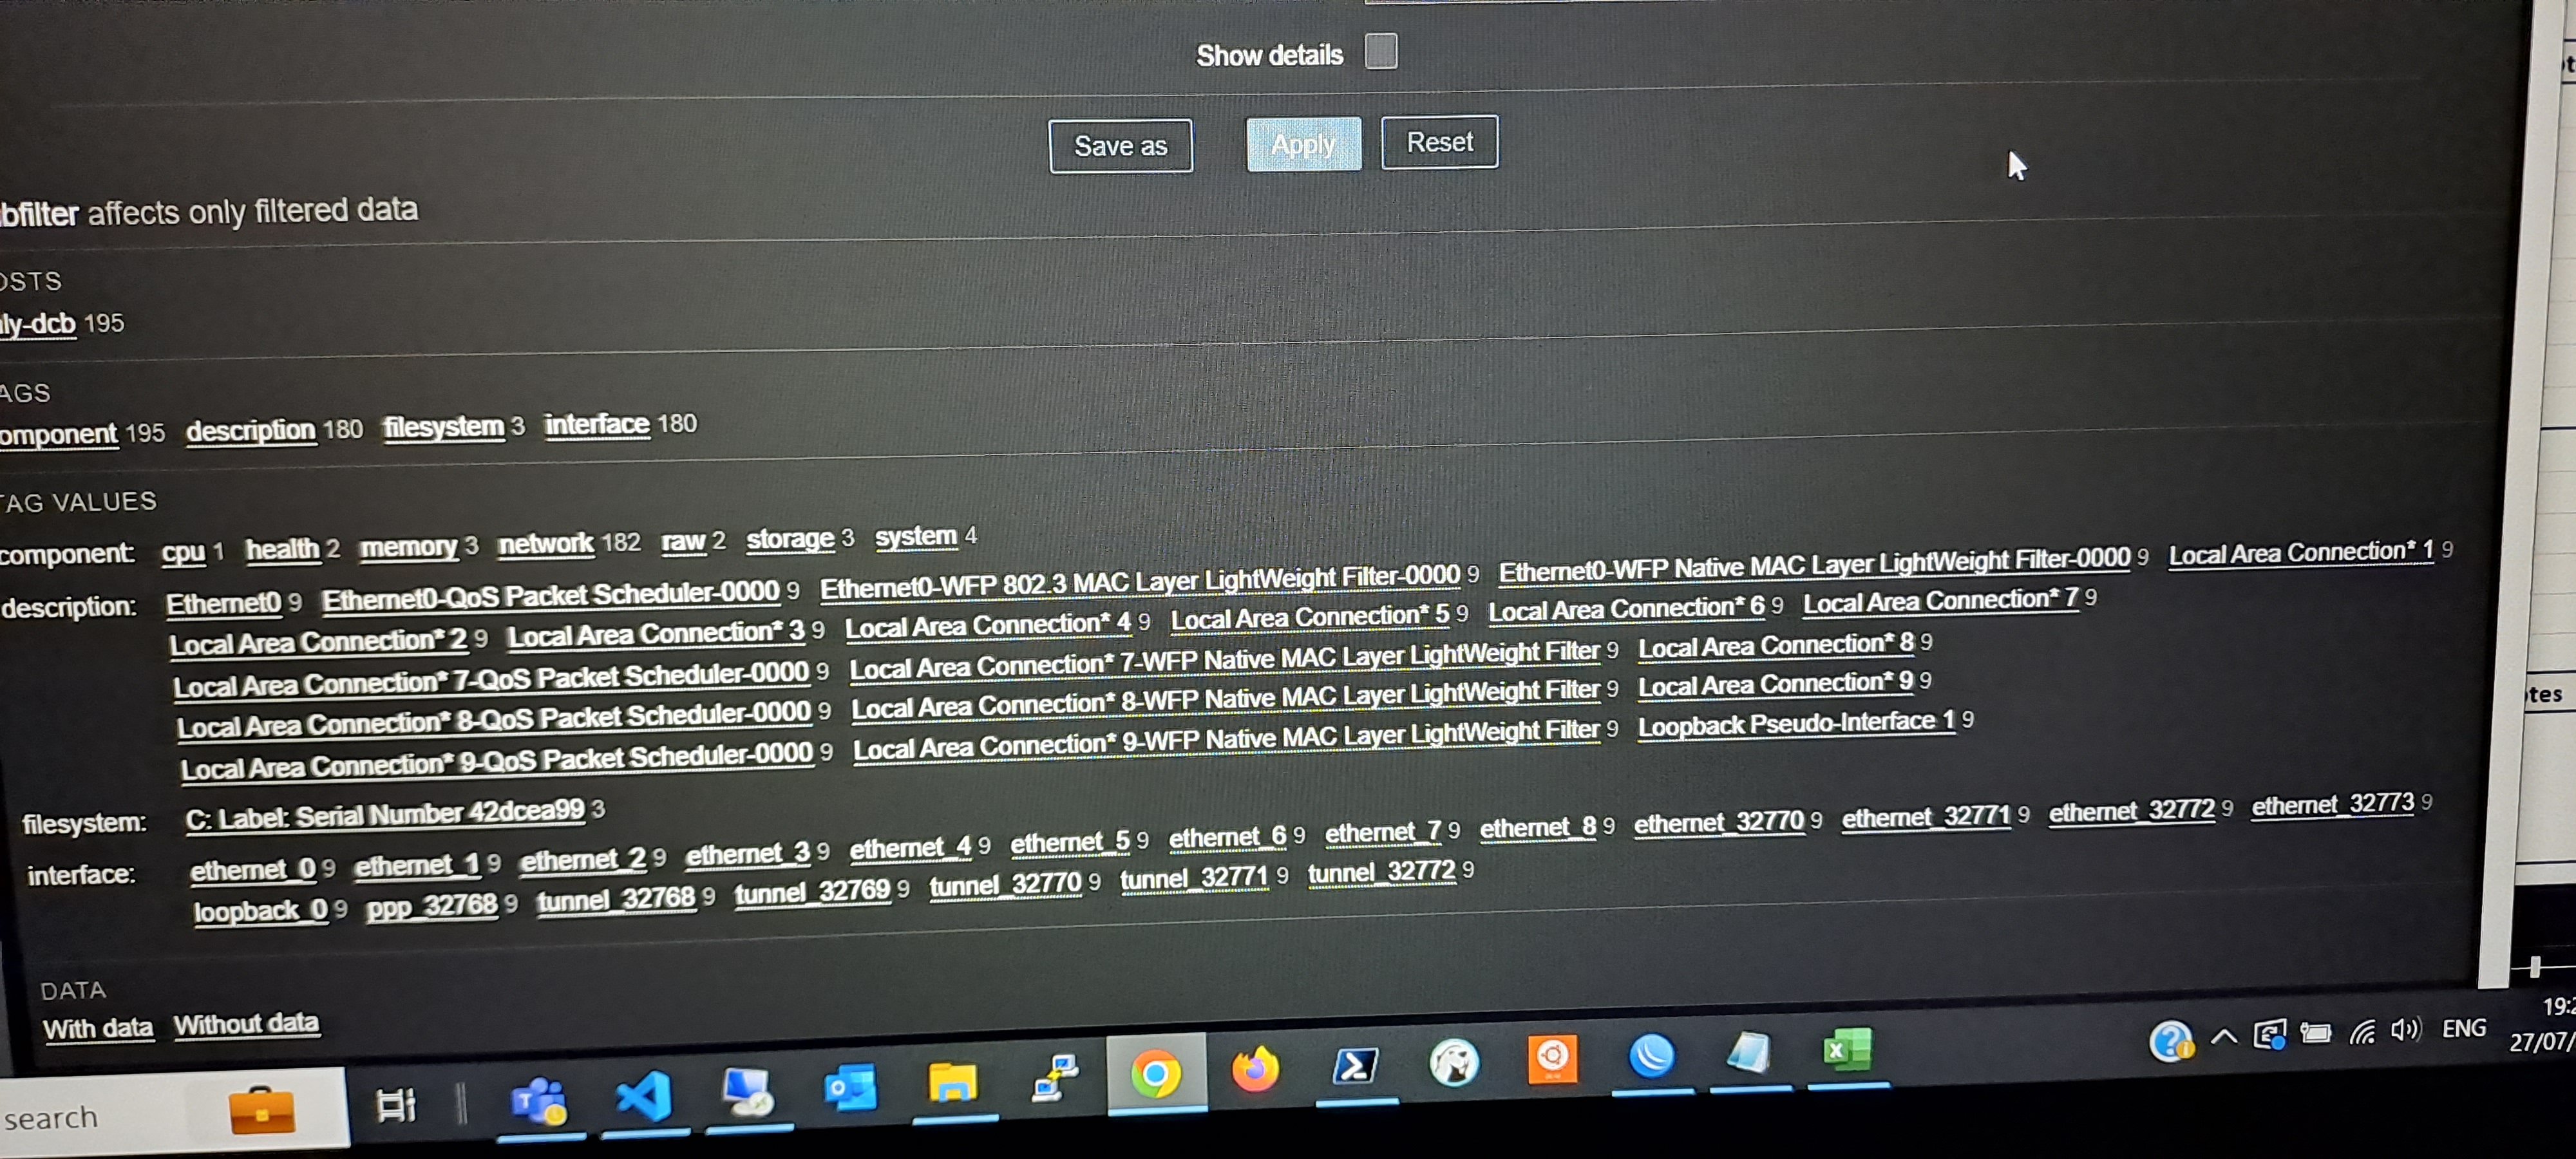
Sorry for the blurry screenshots. Where do I go to disable these extra interfaces? It seems like its picking up every ethernet interface in our whole virtual cluster.
Oh I see, at the top I have to change status from all to enabled and then I can go and pick and choose which to enable. Thanks!
I used Zabbix for about 3 years in our environment before the pandemic necessitated that we have a more mobile solution for RMM and we rolled our SNMP monitoring into our RMM.
I had all the same complaints that you have and honestly I spent more time maintain our zabbix server and nodes than I did on actionable alerts from them. When we switched I was ready to make the switch for sure
Price difference is huge but don't forget to take into account the time you'll spend managing the monitoring tool, that's a "hidden cost" easily overlooked. (However, I have almost no experience with Zabbix so I can't tell if it's a "turnkey" solution like PRTG)
PRTG feels old and clunky. We are getting spammed by a sensor up alert on snmp to a windows server and the sensor never goes down in the first place. The graphs are low quality. It uses so many system resources and warns you against using too many WMI or PS/Bash sensors. It struggles to guess when its overloaded and checking CPU/RAM/disk queue does nothing to help you guess. We have been needing to move from PRTG for a while.
For my needs I just want icmp, http, https, tcp, ssh. But IT requires server/switch/router resource metrics as well. Zabbix is mature, has better dashboard and graphs, has a dark theme, and very efficient with the system resources. We have multiple vendors that use it for monitoring and my friend has replaced PRTG with it for all their networks that they monitor and they look at far more than what we need to monitor. We've also looked at n-able but I'd prefer open source where possible.
I'm going to keep trying to get comfortable with it and when it comes to December I'm hoping we can opt to not renew our PRTG subscription.