[-] root@lemmy.run 2 points 1 year ago

Nice initiative.

[-] root@lemmy.run 9 points 1 year ago

Yea, I have submitted multiple abuse emails with details to domain registrars for scamming and phishing.

Didn’t receive any update from them on any action taken yet.

32
submitted 1 year ago by root@lemmy.run to c/worldnews@lemmy.ml

The bridge collapsed overnight near Columbus, Montana causing several train cars to be immersed in the Yellowstone River.

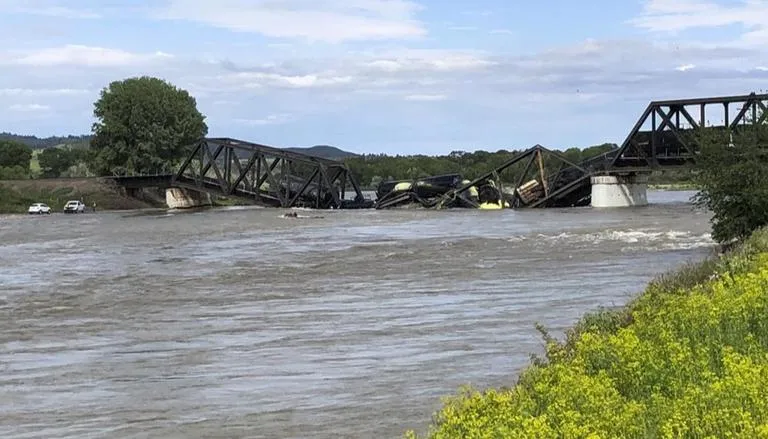
Portions of a freight train plunged into the Yellowstone River due to bridge collapse. (Image: AP)

A bridge that crosses the Yellowstone River in Montana collapsed early Saturday, plunging portions of a freight train carrying hazardous materials into the rushing water below.

The train cars were carrying hot asphalt and molten sulfur, Stillwater County Disaster and Emergency Services said. Officials shut down drinking water intakes downstream while they evaluated the danger after the 6 a.m. accident. An Associated Press reporter witnessed a yellow substance coming out of some of the tank cars.

David Stamey, the county’s chief of emergency services, said there was no immediate danger for the crews working at the site, and the hazardous material was being diluted by the swollen river. There were three asphalt cars and four sulfur cars in the river.

The train crew was safe and no injuries were reported, Montana Rail Link spokesman Andy Garland said in a statement. The asphalt and sulfur both solidify quickly when exposed to cooler temperatures, he said.

Railroad crews were at the scene in Stillwater County, near the town of Columbus, about 40 miles (about 64 kilometers) west of Billings. The area is in a sparsely populated section of the Yellowstone River Valley, surrounded by ranch and farmland. The river there flows away from Yellowstone National Park, which is about 110 miles (177 kilometers) southwest.

“We are committed to addressing any potential impacts to the area as a result of this incident and working to understand the reasons behind the accident,” Garland said.

The bridge collapse also took out a fiber-optic cable providing internet service to many customers in the state, the high-speed provider Global Net said. “This is the major fiber route ... through Montana,” a recording on the company’s phone line said Saturday. “This is affecting all Global Net customers. Connectivity will either be down or extremely slow.”

In neighboring Yellowstone County, officials said they instituted emergency measures at water treatment plants due to the “potential hazmat spill” and asked residents to conserve water.

The cause of the collapse is under investigation. The river was swollen with recent heavy rains, but it’s unclear whether that was a factor. The Yellowstone saw record flooding in 2022 that caused extensive damage to Yellowstone National Park and adjacent towns in Montana. Robert Bea, a retired engineering professor at the University of California Berkeley who has analyzed the causes of hundreds of major disasters, said repeated years of heavy river flows provided a clue to the possible cause.

“The high water flow translates to high forces acting directly on the pier and, importantly, on the river bottom,” Bea said. “You can have erosion or scour that removes support from the foundation. High forces translate to a high likelihood of a structural or foundation failure that could act as a trigger to initiate the accident.”

An old highway bridge that paralleled the railroad bridge — together, they were called the Twin Bridges — was removed in 2021 after the Montana Department of Transportation determined it was in imminent danger of falling. It wasn’t immediately clear when the railroad bridge was constructed or when it was last inspected. Bea said investigators would also want to look at whether there was wear or rust in bridge components as well as a record of maintenance, repair and inspections.

Federal Railroad Administration officials were at the scene working with local authorities. “As part of our investigation, we have requested and will thoroughly review a copy of recent bridge inspection reports from the owner for compliance with federal Bridge Safety Standards,” the agency said in a statement Saturday, noting that responsibility for inspections lies with bridge owners.

Kelly Hitchcock of the Columbus Water Users shut off the flow of river water into an irrigation ditch downstream from the collapsed bridge to prevent contents from the tank cars from reaching nearby farmland. The Stillwater County Sheriff’s Office called the group Saturday morning to warn it about the collapse, Hitchcock said.

The U.S. Environmental Protection Agency notes that sulfur is a common element used as a fertilizer as well as an insecticide, fungicide and rodenticide.

10
submitted 1 year ago by root@lemmy.run to c/linux@lemmy.ml

cross-posted from: https://lemmy.run/post/19113

In this tutorial, we will walk through the process of using the grep command to filter Nginx logs based on a given time range. grep is a powerful command-line tool for searching and filtering text patterns in files.

Step 1: Access the Nginx Log Files First, access the server or machine where Nginx is running. Locate the log files that you want to search. Typically, Nginx log files are located in the /var/log/nginx/ directory. The main log file is usually named access.log. You may have additional log files for different purposes, such as error logging.

Step 2: Understanding Nginx Log Format To effectively search through Nginx logs, it is essential to understand the log format. By default, Nginx uses the combined log format, which consists of several fields, including the timestamp. The timestamp format varies depending on your Nginx configuration but is usually in the following format: [day/month/year:hour:minute:second timezone].

Step 3: Determine the Time Range Decide on the time range you want to filter. You will need to provide the starting and ending timestamps in the log format mentioned earlier. For example, if you want to filter logs between June 24th, 2023, from 10:00 AM to 12:00 PM, the time range would be [24/Jun/2023:10:00:00 and [24/Jun/2023:12:00:00.

Step 4: Use Grep to Filter Logs With the log files and time range identified, you can now use grep to filter the logs. Open a terminal or SSH session to the server and execute the following command:

grep "\[24/Jun/2023:10:00:" /var/log/nginx/access.log | awk '$4 >= "[24/Jun/2023:10:00:" && $4 <= "[24/Jun/2023:12:00:"'

Replace starting_timestamp and ending_timestamp with the appropriate timestamps you determined in Step 3. The grep command searches for lines containing the starting timestamp in the log file specified (access.log in this example). The output is then piped (|) to awk, which filters the logs based on the time range.

Step 5: View Filtered Logs After executing the command, you should see the filtered logs that fall within the specified time range. The output will include the entire log lines matching the filter.

Additional Tips:

  • If you have multiple log files, you can either specify them individually in the grep command or use a wildcard character (*) to match all files in the directory.
  • You can redirect the filtered output to a file by appending > output.log at the end of the command. This will create a file named output.log containing the filtered logs.

That's it! You have successfully filtered Nginx logs using grep based on a given time range. Feel free to explore additional options and features of grep to further refine your log analysis.

[-] root@lemmy.run 17 points 1 year ago

For SysAdmin you can use !Sysadmin@lemmy.ml.

For LinuxAdmin you can use !linuxadmin@lemmy.run.

I haven't found one for IT and Helpdesk yet, but I am pretty sure they are out there.

1
submitted 1 year ago by root@lemmy.run to c/linux@programming.dev

cross-posted from: https://lemmy.run/post/15922

Running Commands in Parallel in Linux

In Linux, you can execute multiple commands simultaneously by running them in parallel. This can help improve the overall execution time and efficiency of your tasks. In this tutorial, we will explore different methods to run commands in parallel in a Linux environment.

Method 1: Using & (ampersand) symbol

The simplest way to run commands in parallel is by appending the & symbol at the end of each command. Here's how you can do it:

command_1 & command_2 & command_3 &

This syntax allows each command to run in the background, enabling parallel execution. The shell will immediately return the command prompt, and the commands will execute concurrently.

For example, to compress three different files in parallel using the gzip command:

gzip file1.txt & gzip file2.txt & gzip file3.txt &

Method 2: Using xargs with -P option

The xargs command is useful for building and executing commands from standard input. By utilizing its -P option, you can specify the maximum number of commands to run in parallel. Here's an example:

echo -e "command_1\ncommand_2\ncommand_3" | xargs -P 3 -I {} sh -c "{}" &

In this example, we use the echo command to generate a list of commands separated by newline characters. This list is then piped (|) to xargs, which executes each command in parallel. The -P 3 option indicates that a maximum of three commands should run concurrently. Adjust the number according to your requirements.

For instance, to run three different wget commands in parallel to download files:

echo -e "wget http://example.com/file1.txt\nwget http://example.com/file2.txt\nwget http://example.com/file3.txt" | xargs -P 3 -I {} sh -c "{}" &

Method 3: Using GNU Parallel

GNU Parallel is a powerful tool specifically designed to run jobs in parallel. It provides extensive features and flexibility. To use GNU Parallel, follow these steps:

  1. Install GNU Parallel if it's not already installed. You can typically find it in your Linux distribution's package manager.

  2. Create a file (e.g., commands.txt) and add one command per line:

    command_1
    command_2
    command_3
    
  3. Run the following command to execute the commands in parallel:

    parallel -j 3 < commands.txt
    

    The -j 3 option specifies the maximum number of parallel jobs to run. Adjust it according to your needs.

For example, if you have a file called urls.txt containing URLs and you want to download them in parallel using wget:

parallel -j 3 wget {} < urls.txt

GNU Parallel also offers numerous advanced options for complex parallel job management. Refer to its documentation for further information.

Conclusion

Running commands in parallel can significantly speed up your tasks by utilizing the available resources efficiently. In this tutorial, you've learned three methods for running commands in parallel in Linux:

  1. Using the & symbol to run commands in the background.
  2. Utilizing xargs with the -P option to define the maximum parallelism.
  3. Using GNU Parallel for advanced parallel job management.

Choose the method that best suits your requirements and optimize your workflow by executing commands concurrently.

67
submitted 1 year ago by root@lemmy.run to c/linux@lemmy.ml

cross-posted from: https://lemmy.run/post/15922

Running Commands in Parallel in Linux

In Linux, you can execute multiple commands simultaneously by running them in parallel. This can help improve the overall execution time and efficiency of your tasks. In this tutorial, we will explore different methods to run commands in parallel in a Linux environment.

Method 1: Using & (ampersand) symbol

The simplest way to run commands in parallel is by appending the & symbol at the end of each command. Here's how you can do it:

command_1 & command_2 & command_3 &

This syntax allows each command to run in the background, enabling parallel execution. The shell will immediately return the command prompt, and the commands will execute concurrently.

For example, to compress three different files in parallel using the gzip command:

gzip file1.txt & gzip file2.txt & gzip file3.txt &

Method 2: Using xargs with -P option

The xargs command is useful for building and executing commands from standard input. By utilizing its -P option, you can specify the maximum number of commands to run in parallel. Here's an example:

echo -e "command_1\ncommand_2\ncommand_3" | xargs -P 3 -I {} sh -c "{}" &

In this example, we use the echo command to generate a list of commands separated by newline characters. This list is then piped (|) to xargs, which executes each command in parallel. The -P 3 option indicates that a maximum of three commands should run concurrently. Adjust the number according to your requirements.

For instance, to run three different wget commands in parallel to download files:

echo -e "wget http://example.com/file1.txt\nwget http://example.com/file2.txt\nwget http://example.com/file3.txt" | xargs -P 3 -I {} sh -c "{}" &

Method 3: Using GNU Parallel

GNU Parallel is a powerful tool specifically designed to run jobs in parallel. It provides extensive features and flexibility. To use GNU Parallel, follow these steps:

  1. Install GNU Parallel if it's not already installed. You can typically find it in your Linux distribution's package manager.

  2. Create a file (e.g., commands.txt) and add one command per line:

    command_1
    command_2
    command_3
    
  3. Run the following command to execute the commands in parallel:

    parallel -j 3 < commands.txt
    

    The -j 3 option specifies the maximum number of parallel jobs to run. Adjust it according to your needs.

For example, if you have a file called urls.txt containing URLs and you want to download them in parallel using wget:

parallel -j 3 wget {} < urls.txt

GNU Parallel also offers numerous advanced options for complex parallel job management. Refer to its documentation for further information.

Conclusion

Running commands in parallel can significantly speed up your tasks by utilizing the available resources efficiently. In this tutorial, you've learned three methods for running commands in parallel in Linux:

  1. Using the & symbol to run commands in the background.
  2. Utilizing xargs with the -P option to define the maximum parallelism.
  3. Using GNU Parallel for advanced parallel job management.

Choose the method that best suits your requirements and optimize your workflow by executing commands concurrently.

54
submitted 1 year ago by root@lemmy.run to c/worldnews@lemmy.ml

As per reports, OceanGate's carbon fiber hull was unsuited for dives into such depths. In a video now going viral, CEO Stockton Rush is seen admitting that he knows there are issues, but he is taking the risk anyway.

OceanGate's sub Titan, (L), wreck of the Titanic on the seafloor (R)

The HMS Titanic had sunk on April 15, 1912, taking more than 1500 people with it. 111 years later, 4 high-profile passengers and the CEO of the OceanGate company, who was the pilot of the tourist submersible ‘Titan’, died after their sub imploded due to extreme pressure deep in the North Atlantic Ocean.

The US Coast Guard has confirmed that one of their ROVs from the vessel Horizon Arctic located the debris of a tail comb from the OceanGate sub-Titan approximately 1600 feet from the bow wreckage of the Titanic on the seafloor. Other debris was also found scattered in the general area. The debris was confirmed to be from Titan, the lost tourist sub from OceanGate.

Speaking to the media, OceanGate’s co-founder Guillermo Stohnlein said that in the case of any failure, the implosion would have been instantaneous.

It is notable here that the Titanic wreckage sits at a depth of around 3800 meters. As per reports, the implosion at a depth like that causes immediate crushing of the vessel and everything inside it. The pilot and the passengers would have died within a few milliseconds.

CEO of OceanGate was the pilot, the 4 passengers included the billionaire explorer Hamish Harding, a British-Pakistani father-son duo named Shahzada Dawood and Suleiman Dawood, and the popular ‘Mr Titanic’ Paul-Henry Nargeolet. Nargeolet, a French Navy veteran, was part of the first expedition to visit the wreck in 1987, just two years after it was found. He has earned the moniker ‘Mr. Titanic’ as he has reportedly spent more time at the wreck than any other explorer.

The deceased CEO’s wife is a descendant of an old couple who died in the Titanic disaster in 1912

Wendy Rush, the wife of OceanGate CEO Stockton Rush, is the great-great-grandaughter of Isidor and Ida Straus, an old couple who had perished in the Titanic disaster in 1912. The old couple was depicted in James Cameron’s Oscar-winning movie too.

Isidor and Ida Straus were first-class passengers who had refused to board a lifeboat and had gone down with the ship on that fateful night in 1912.

Titanic tours

Tourists spend thousands of dollars to be taken to the wreckage of the liner, 12,500ft underwater. It is claimed that OceanGate Expeditions charges $250,000 (£195,270) for a place on its eight-day expedition.

It is important to note that submersibles are different from submarines. A submersible needs a mother ship that can launch it and recover it. Contrary to it, a submarine has enough power to leave port and come back to port on its own.

37 years ago, the wreckage of the Titanic was discovered in the Atlantic, around 400 nautical miles from Newfoundland, Canada. A team led by legendary explorer Robert Ballard had found the vessel.

OceanGate sub had ‘quality’ issues

As per reports, OceanGate’s carbon fiber hull was unsuited for dives into such depths. In a video now going viral, CEO Stockton Rush is seen admitting that he knows there are issues, but he is taking the risk anyway.

On Sunday morning, the surface crew of the accompanying tug boat had lost contact with the submersible one hour and 45 minutes after it went down the sea.

OceanGate staff had confirmed that in addition to a very limited oxygen supply, those onboard will also be experiencing frigid temperatures.

As per reports, David Lochridge, former director of marine operations associated with OceanGate, had refused to greenlight the sub, citing that the viewport is only certified to withstand pressure up to the depth of 1300 meters. The wreckage of the Titanic sits at a depth of 3800 meters on the ocean floor.

Lochridge was fired by OceanGate later. Months later, over 3 dozen people from the industry, including deep sea explorers and oceanographers included, had voiced concerns and warned the company of potential ‘catastrophic problems’ with their tours using that sub. Lochridge had also stated that OceanGate was unwilling to have the sub inspected and certified by established agencies.

[-] root@lemmy.run 3 points 1 year ago

Haha, that is why I am glad I replaced all my contents with garbage before removing and waited for couple of days before removing them.

[-] root@lemmy.run 7 points 1 year ago

Seems like another good company is being sacrificed to corporate greed.

[-] root@lemmy.run 40 points 1 year ago

I nuked all my posts and comments.

Glad that I left the place, it can burn and go to hell for all I care.

On the other hand there’s enough constructive engagement happening here to fulfil my needs.

[-] root@lemmy.run 1 points 1 year ago

I did not.

Thank you for sharing it. Something you learn everyday, eh 😀.

[-] root@lemmy.run 1 points 1 year ago
19
submitted 1 year ago by root@lemmy.run to c/linux@lemmy.ml

cross-posted from: https://lemmy.run/post/10868

Beginner's Guide to grep

grep is a powerful command-line tool used for searching and filtering text in files. It allows you to find specific patterns or strings within files, making it an invaluable tool for developers, sysadmins, and anyone working with text data. In this guide, we will cover the basics of using grep and provide you with some useful examples to get started.

Installation

grep is a standard utility on most Unix-like systems, including Linux and macOS. If you're using a Windows operating system, you can install it by using the Windows Subsystem for Linux (WSL) or through tools like Git Bash, Cygwin, or MinGW.

Basic Usage

The basic syntax of grep is as follows:

grep [options] pattern [file(s)]
  • options: Optional flags that modify the behavior of grep.
  • pattern: The pattern or regular expression to search for.
  • file(s): Optional file(s) to search within. If not provided, grep will read from standard input.

Examples

Searching in a Single File

To search for a specific pattern in a single file, use the following command:

grep "pattern" file.txt

Replace "pattern" with the text you want to search for and file.txt with the name of the file you want to search in.

Searching in Multiple Files

If you want to search for a pattern across multiple files, use the following command:

grep "pattern" file1.txt file2.txt file3.txt

You can specify as many files as you want, separating them with spaces.

Ignoring Case

By default, grep is case-sensitive. To perform a case-insensitive search, use the -i option:

grep -i "pattern" file.txt

Displaying Line Numbers

To display line numbers along with the matching lines, use the -n option:

grep -n "pattern" file.txt

This can be helpful when you want to know the line numbers where matches occur.

Searching Recursively

To search for a pattern in all files within a directory and its subdirectories, use the -r option (recursive search):

grep -r "pattern" directory/

Replace directory/ with the path to the directory you want to search in.

Using Regular Expressions

grep supports regular expressions for more advanced pattern matching. Here's an example using a regular expression to search for email addresses:

grep -E "\b[A-Za-z0-9._%+-]+@[A-Za-z0-9.-]+\.[A-Za-z]{2,}\b" file.txt

In this case, the -E option enables extended regular expressions.

Conclusion

grep is a versatile tool that can greatly enhance your text searching and filtering capabilities. With the knowledge you've gained in this beginner's guide, you can start using grep to quickly find and extract the information you need from text files. Experiment with different options and explore more advanced regular expressions to further expand your skills with grep. Happy grepping!

2
submitted 1 year ago by root@lemmy.run to c/linux@programming.dev

cross-posted from: https://lemmy.run/post/10868

Beginner's Guide to grep

grep is a powerful command-line tool used for searching and filtering text in files. It allows you to find specific patterns or strings within files, making it an invaluable tool for developers, sysadmins, and anyone working with text data. In this guide, we will cover the basics of using grep and provide you with some useful examples to get started.

Installation

grep is a standard utility on most Unix-like systems, including Linux and macOS. If you're using a Windows operating system, you can install it by using the Windows Subsystem for Linux (WSL) or through tools like Git Bash, Cygwin, or MinGW.

Basic Usage

The basic syntax of grep is as follows:

grep [options] pattern [file(s)]
  • options: Optional flags that modify the behavior of grep.
  • pattern: The pattern or regular expression to search for.
  • file(s): Optional file(s) to search within. If not provided, grep will read from standard input.

Examples

Searching in a Single File

To search for a specific pattern in a single file, use the following command:

grep "pattern" file.txt

Replace "pattern" with the text you want to search for and file.txt with the name of the file you want to search in.

Searching in Multiple Files

If you want to search for a pattern across multiple files, use the following command:

grep "pattern" file1.txt file2.txt file3.txt

You can specify as many files as you want, separating them with spaces.

Ignoring Case

By default, grep is case-sensitive. To perform a case-insensitive search, use the -i option:

grep -i "pattern" file.txt

Displaying Line Numbers

To display line numbers along with the matching lines, use the -n option:

grep -n "pattern" file.txt

This can be helpful when you want to know the line numbers where matches occur.

Searching Recursively

To search for a pattern in all files within a directory and its subdirectories, use the -r option (recursive search):

grep -r "pattern" directory/

Replace directory/ with the path to the directory you want to search in.

Using Regular Expressions

grep supports regular expressions for more advanced pattern matching. Here's an example using a regular expression to search for email addresses:

grep -E "\b[A-Za-z0-9._%+-]+@[A-Za-z0-9.-]+\.[A-Za-z]{2,}\b" file.txt

In this case, the -E option enables extended regular expressions.

Conclusion

grep is a versatile tool that can greatly enhance your text searching and filtering capabilities. With the knowledge you've gained in this beginner's guide, you can start using grep to quickly find and extract the information you need from text files. Experiment with different options and explore more advanced regular expressions to further expand your skills with grep. Happy grepping!

1

cross-posted from: https://lemmy.run/post/10475

Testing Service Accounts in Kubernetes

Service accounts in Kubernetes are used to provide a secure way for applications and services to authenticate and interact with the Kubernetes API. Testing service accounts ensures their functionality and security. In this guide, we will explore different methods to test service accounts in Kubernetes.

1. Verifying Service Account Existence

To start testing service accounts, you first need to ensure they exist in your Kubernetes cluster. You can use the following command to list all the available service accounts:

kubectl get serviceaccounts

Verify that the service account you want to test is present in the output. If it's missing, you may need to create it using a YAML manifest or the kubectl create serviceaccount command.

2. Checking Service Account Permissions

After confirming the existence of the service account, the next step is to verify its permissions. Service accounts in Kubernetes are associated with roles or cluster roles, which define what resources and actions they can access.

To check the permissions of a service account, you can use the kubectl auth can-i command. For example, to check if a service account can create pods, run:

kubectl auth can-i create pods --as=system:serviceaccount:<namespace>:<service-account>

Replace <namespace> with the desired namespace and <service-account> with the name of the service account.

3. Testing Service Account Authentication

Service accounts authenticate with the Kubernetes API using bearer tokens. To test service account authentication, you can manually retrieve the token associated with the service account and use it to authenticate requests.

To get the token for a service account, run:

kubectl get secret <service-account-token-secret> -o jsonpath="{.data.token}" | base64 --decode

Replace <service-account-token-secret> with the actual name of the secret associated with the service account. This command decodes and outputs the service account token.

You can then use the obtained token to authenticate requests to the Kubernetes API, for example, by including it in the Authorization header using tools like curl or writing a simple program.

4. Testing Service Account RBAC Policies

Role-Based Access Control (RBAC) policies govern the access permissions for service accounts. It's crucial to test these policies to ensure service accounts have the appropriate level of access.

One way to test RBAC policies is by creating a Pod that uses the service account you want to test and attempting to perform actions that the service account should or shouldn't be allowed to do. Observe the behavior and verify if the access is granted or denied as expected.

5. Automated Testing

To streamline the testing process, you can create automated tests using testing frameworks and tools specific to Kubernetes. For example, the Kubernetes Test Framework (KTF) provides a set of libraries and utilities for writing tests for Kubernetes components, including service accounts.

Using such frameworks allows you to write comprehensive test cases to validate service account behavior, permissions, and RBAC policies automatically.

Conclusion

Testing service accounts in Kubernetes ensures their proper functioning and adherence to security policies. By verifying service account existence, checking permissions, testing authentication, and validating RBAC policies, you can confidently use and rely on service accounts in your Kubernetes deployments.

Remember, service accounts are a critical security component, so it's important to regularly test and review their configuration to prevent unauthorized access and potential security breaches.

1

cross-posted from: https://lemmy.run/post/10206

Creating a Helm Chart for Kubernetes

In this tutorial, we will learn how to create a Helm chart for deploying applications on Kubernetes. Helm is a package manager for Kubernetes that simplifies the deployment and management of applications. By using Helm charts, you can define and version your application deployments as reusable templates.

Prerequisites

Before we begin, make sure you have the following prerequisites installed:

  • Helm: Follow the official Helm documentation for installation instructions.

Step 1: Initialize a Helm Chart

To start creating a Helm chart, open a terminal and navigate to the directory where you want to create your chart. Then, run the following command:

helm create my-chart

This will create a new directory named my-chart with the basic structure of a Helm chart.

Step 2: Customize the Chart

Inside the my-chart directory, you will find several files and directories. The most important ones are:

  • Chart.yaml: This file contains metadata about the chart, such as its name, version, and dependencies.
  • values.yaml: This file defines the default values for the configuration options used in the chart.
  • templates/: This directory contains the template files for deploying Kubernetes resources.

You can customize the chart by modifying these files and adding new ones as needed. For example, you can update the Chart.yaml file with your desired metadata and edit the values.yaml file to set default configuration values.

Step 3: Define Kubernetes Resources

To deploy your application on Kubernetes, you need to define the necessary Kubernetes resources in the templates/ directory. Helm uses the Go template language to generate Kubernetes manifests from these templates.

For example, you can create a deployment.yaml template to define a Kubernetes Deployment:

apiVersion: apps/v1
kind: Deployment
metadata:
  name: {{ .Release.Name }}-deployment
spec:
  replicas: {{ .Values.replicaCount }}
  template:
    metadata:
      labels:
        app: {{ .Release.Name }}
    spec:
      containers:
        - name: {{ .Release.Name }}
          image: {{ .Values.image.repository }}:{{ .Values.image.tag }}
          ports:
            - containerPort: {{ .Values.containerPort }}

This template uses the values defined in values.yaml to customize the Deployment's name, replica count, image, and container port.

Step 4: Package and Install the Chart

Once you have defined your Helm chart and customized the templates, you can package and install it on a Kubernetes cluster. To package the chart, run the following command:

helm package my-chart

This will create a .tgz file containing the packaged chart.

To install the chart on a Kubernetes cluster, use the following command:

helm install my-release my-chart-0.1.0.tgz

Replace my-release with the desired release name and my-chart-0.1.0.tgz with the name of your packaged chart.

Conclusion

Congratulations! You have learned how to create a Helm chart for deploying applications on Kubernetes. By leveraging Helm's package management capabilities, you can simplify the deployment and management of your Kubernetes-based applications.

Feel free to explore the Helm documentation for more advanced features and best practices.

Happy charting!

-1
submitted 1 year ago by root@lemmy.run to c/linux@lemmy.ml

cross-posted from: https://lemmy.run/post/10475

Testing Service Accounts in Kubernetes

Service accounts in Kubernetes are used to provide a secure way for applications and services to authenticate and interact with the Kubernetes API. Testing service accounts ensures their functionality and security. In this guide, we will explore different methods to test service accounts in Kubernetes.

1. Verifying Service Account Existence

To start testing service accounts, you first need to ensure they exist in your Kubernetes cluster. You can use the following command to list all the available service accounts:

kubectl get serviceaccounts

Verify that the service account you want to test is present in the output. If it's missing, you may need to create it using a YAML manifest or the kubectl create serviceaccount command.

2. Checking Service Account Permissions

After confirming the existence of the service account, the next step is to verify its permissions. Service accounts in Kubernetes are associated with roles or cluster roles, which define what resources and actions they can access.

To check the permissions of a service account, you can use the kubectl auth can-i command. For example, to check if a service account can create pods, run:

kubectl auth can-i create pods --as=system:serviceaccount:<namespace>:<service-account>

Replace <namespace> with the desired namespace and <service-account> with the name of the service account.

3. Testing Service Account Authentication

Service accounts authenticate with the Kubernetes API using bearer tokens. To test service account authentication, you can manually retrieve the token associated with the service account and use it to authenticate requests.

To get the token for a service account, run:

kubectl get secret <service-account-token-secret> -o jsonpath="{.data.token}" | base64 --decode

Replace <service-account-token-secret> with the actual name of the secret associated with the service account. This command decodes and outputs the service account token.

You can then use the obtained token to authenticate requests to the Kubernetes API, for example, by including it in the Authorization header using tools like curl or writing a simple program.

4. Testing Service Account RBAC Policies

Role-Based Access Control (RBAC) policies govern the access permissions for service accounts. It's crucial to test these policies to ensure service accounts have the appropriate level of access.

One way to test RBAC policies is by creating a Pod that uses the service account you want to test and attempting to perform actions that the service account should or shouldn't be allowed to do. Observe the behavior and verify if the access is granted or denied as expected.

5. Automated Testing

To streamline the testing process, you can create automated tests using testing frameworks and tools specific to Kubernetes. For example, the Kubernetes Test Framework (KTF) provides a set of libraries and utilities for writing tests for Kubernetes components, including service accounts.

Using such frameworks allows you to write comprehensive test cases to validate service account behavior, permissions, and RBAC policies automatically.

Conclusion

Testing service accounts in Kubernetes ensures their proper functioning and adherence to security policies. By verifying service account existence, checking permissions, testing authentication, and validating RBAC policies, you can confidently use and rely on service accounts in your Kubernetes deployments.

Remember, service accounts are a critical security component, so it's important to regularly test and review their configuration to prevent unauthorized access and potential security breaches.

1
submitted 1 year ago by root@lemmy.run to c/sysadmin@lemmy.ml

cross-posted from: https://lemmy.run/post/10475

Testing Service Accounts in Kubernetes

Service accounts in Kubernetes are used to provide a secure way for applications and services to authenticate and interact with the Kubernetes API. Testing service accounts ensures their functionality and security. In this guide, we will explore different methods to test service accounts in Kubernetes.

1. Verifying Service Account Existence

To start testing service accounts, you first need to ensure they exist in your Kubernetes cluster. You can use the following command to list all the available service accounts:

kubectl get serviceaccounts

Verify that the service account you want to test is present in the output. If it's missing, you may need to create it using a YAML manifest or the kubectl create serviceaccount command.

2. Checking Service Account Permissions

After confirming the existence of the service account, the next step is to verify its permissions. Service accounts in Kubernetes are associated with roles or cluster roles, which define what resources and actions they can access.

To check the permissions of a service account, you can use the kubectl auth can-i command. For example, to check if a service account can create pods, run:

kubectl auth can-i create pods --as=system:serviceaccount:<namespace>:<service-account>

Replace <namespace> with the desired namespace and <service-account> with the name of the service account.

3. Testing Service Account Authentication

Service accounts authenticate with the Kubernetes API using bearer tokens. To test service account authentication, you can manually retrieve the token associated with the service account and use it to authenticate requests.

To get the token for a service account, run:

kubectl get secret <service-account-token-secret> -o jsonpath="{.data.token}" | base64 --decode

Replace <service-account-token-secret> with the actual name of the secret associated with the service account. This command decodes and outputs the service account token.

You can then use the obtained token to authenticate requests to the Kubernetes API, for example, by including it in the Authorization header using tools like curl or writing a simple program.

4. Testing Service Account RBAC Policies

Role-Based Access Control (RBAC) policies govern the access permissions for service accounts. It's crucial to test these policies to ensure service accounts have the appropriate level of access.

One way to test RBAC policies is by creating a Pod that uses the service account you want to test and attempting to perform actions that the service account should or shouldn't be allowed to do. Observe the behavior and verify if the access is granted or denied as expected.

5. Automated Testing

To streamline the testing process, you can create automated tests using testing frameworks and tools specific to Kubernetes. For example, the Kubernetes Test Framework (KTF) provides a set of libraries and utilities for writing tests for Kubernetes components, including service accounts.

Using such frameworks allows you to write comprehensive test cases to validate service account behavior, permissions, and RBAC policies automatically.

Conclusion

Testing service accounts in Kubernetes ensures their proper functioning and adherence to security policies. By verifying service account existence, checking permissions, testing authentication, and validating RBAC policies, you can confidently use and rely on service accounts in your Kubernetes deployments.

Remember, service accounts are a critical security component, so it's important to regularly test and review their configuration to prevent unauthorized access and potential security breaches.

2
submitted 1 year ago by root@lemmy.run to c/linux@lemmy.ml

cross-posted from: https://lemmy.run/post/10206

Creating a Helm Chart for Kubernetes

In this tutorial, we will learn how to create a Helm chart for deploying applications on Kubernetes. Helm is a package manager for Kubernetes that simplifies the deployment and management of applications. By using Helm charts, you can define and version your application deployments as reusable templates.

Prerequisites

Before we begin, make sure you have the following prerequisites installed:

  • Helm: Follow the official Helm documentation for installation instructions.

Step 1: Initialize a Helm Chart

To start creating a Helm chart, open a terminal and navigate to the directory where you want to create your chart. Then, run the following command:

helm create my-chart

This will create a new directory named my-chart with the basic structure of a Helm chart.

Step 2: Customize the Chart

Inside the my-chart directory, you will find several files and directories. The most important ones are:

  • Chart.yaml: This file contains metadata about the chart, such as its name, version, and dependencies.
  • values.yaml: This file defines the default values for the configuration options used in the chart.
  • templates/: This directory contains the template files for deploying Kubernetes resources.

You can customize the chart by modifying these files and adding new ones as needed. For example, you can update the Chart.yaml file with your desired metadata and edit the values.yaml file to set default configuration values.

Step 3: Define Kubernetes Resources

To deploy your application on Kubernetes, you need to define the necessary Kubernetes resources in the templates/ directory. Helm uses the Go template language to generate Kubernetes manifests from these templates.

For example, you can create a deployment.yaml template to define a Kubernetes Deployment:

apiVersion: apps/v1
kind: Deployment
metadata:
  name: {{ .Release.Name }}-deployment
spec:
  replicas: {{ .Values.replicaCount }}
  template:
    metadata:
      labels:
        app: {{ .Release.Name }}
    spec:
      containers:
        - name: {{ .Release.Name }}
          image: {{ .Values.image.repository }}:{{ .Values.image.tag }}
          ports:
            - containerPort: {{ .Values.containerPort }}

This template uses the values defined in values.yaml to customize the Deployment's name, replica count, image, and container port.

Step 4: Package and Install the Chart

Once you have defined your Helm chart and customized the templates, you can package and install it on a Kubernetes cluster. To package the chart, run the following command:

helm package my-chart

This will create a .tgz file containing the packaged chart.

To install the chart on a Kubernetes cluster, use the following command:

helm install my-release my-chart-0.1.0.tgz

Replace my-release with the desired release name and my-chart-0.1.0.tgz with the name of your packaged chart.

Conclusion

Congratulations! You have learned how to create a Helm chart for deploying applications on Kubernetes. By leveraging Helm's package management capabilities, you can simplify the deployment and management of your Kubernetes-based applications.

Feel free to explore the Helm documentation for more advanced features and best practices.

Happy charting!

[-] root@lemmy.run 1 points 1 year ago

This seems like a bug.

Also it could be that lemmy.world is overloaded and is stuck at processing to clear this.

Keep it documented and submit a bug report so that devs can look at it when they can.

[-] root@lemmy.run 1 points 1 year ago

Yeap, this is definitely weird.

How about you try to login in private/incognito?

Do you still see it?

If it is, I would advise you to submit a bug report to lemmy devs here.

[-] root@lemmy.run 1 points 1 year ago

Hmm, in that case, try to clean your browser cache.

[-] root@lemmy.run 1 points 1 year ago

You can go to the notifications and mark it as read by clicking the checkmark. It should disappear after that.

view more: next ›

root

joined 1 year ago